Tesla stands out in the market due to its innovations in electric vehicles, solar power, and artificial intelligence. Yet, how will these factors affect its stock price in the long term? This analysis aims to forecast TSLA's stock price from 2026 to 2050, carefully considering technological advancements, shifts in the economic landscape, and the evolving competitive environment.
This article explores various scenarios and factors that may impact Tesla's future trajectory, providing a detailed overview of the company's stock price prospects.
The article covers the following subjects:
- Major Takeaways
- TSLA Real-Time Market Status
- TSLA Stock Price Forecast for 2026 Based on Technical Analysis
- Analysts' TSLA Price Projections for 2027
- Analysts' TSLA Price Projections for 2028
- Analysts' TSLA Price Projections for 2029
- Analysts' TSLA Price Projections for 2030
- Analysts' TSLA Price Projections until 2050
- TSLA (Tesla) Market Sentiment on Social Media
- TSLA Price History
- TSLA Shares Fundamental Analysis
- More Facts About TSLA
- How We Make Forecasts
- Conclusion: Is TSLA a Good Investment?
- TSLA Price Prediction FAQ
Major Takeaways
- The current TSLA stock price is $313.03 as of 25.07.2026.
- Tesla reached its all-time high of $498.46 on 22.12.2025. The all-time low of $0.99 was set on 07.07.2010.
- According to analysts, TSLA's stock price will range between $427.00 and $502.94 throughout 2026. Some experts predict a decline to $227.50.
- In 2027, Tesla's stock is likely to continue its uptrend. Forecasting platforms believe the price will reach $696.70–$838.00. Some experts project a more moderate increase to $430.36.
- Many analysts expect the uptrend to continue through 2028–2030. The price is predicted to soar to $956.04–$1,767.69. According to more conservative forecasts, the stock may rise to $531.78.
- The long-term outlook for 2040–2050 is generally positive. Experts estimate that TSLA's share price may surge to $4,644.93–$5,878.37.
TSLA Real-Time Market Status
The TSLA price is trading at $313.03 as of 25.07.2026.
To determine the current state of Tesla Inc. shares, remember to track the company's financial indicators:
- Market capitalization is a measure of a company's net value as perceived by investors.
- The number of shares outstanding signifies the total number of shares available in the market.
- Earnings per share (EPS) represent the amount of a company's earnings available to each share, revealing its profitability.
- The price-to-earnings ratio (P/E) indicates how high the stock price is in relation to the earnings.
- Monthly volatility illustrates 30-day fluctuations in the asset price.
- The average trading volume indicates how many shares are traded on average over a given period.
Indicator | Value |
Market cap | $1.5 trillion |
Shares outstanding | 3.75 billion |
Earnings per share (EPS) | $0.15 |
Price-to-earnings ratio (P/E) | 367.4 |
52-week range | $288.77–$498.83 |
3-month average trading volume | 58.084 million shares |
TSLA Stock Price Forecast for 2026 Based on Technical Analysis
Let's perform a technical analysis of the TSLA price on a weekly time frame to forecast its movement over the coming year.
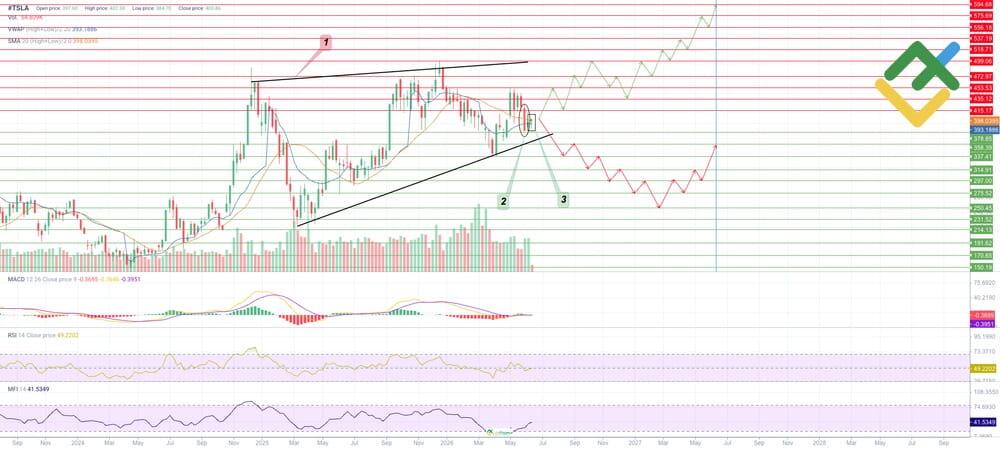
Since early June 2026, Tesla's stock price has been pulling back. Technical indicators and candlestick patterns are giving mixed signals:
- A major Rising Wedge (1) pattern is forming on the chart. The price is expected to break below this pattern, potentially targeting $214.13 or lower. Near the key support level of $378.85, a Bullish Harami (2) and a Hammer (3) candlestick patterns have emerged, signaling a possible bullish reversal.
- MACD is moving sideways near the zero line, showing no clear price trend yet.
- The RSI reading is holding at 49 and may either rise or fall.
- The MFI is rising, signaling a gradual inflow of liquidity into the asset.
- The VWAP and the SMA20 line are below the market price, indicating that bulls are dominating the market.
Below is TSLA's 12-month price forecast.
Month | Minimum, $ | Average, $ | Maximum, $ |
July 2026 | 377.44 | 395.41 | 413.39 |
August 2026 | 405.87 | 429.28 | 452.69 |
September 2026 | 412.55 | 435.12 | 457.70 |
October 2026 | 410.88 | 440.98 | 471.08 |
November 2026 | 449.34 | 475.26 | 501.18 |
December 2026 | 435.97 | 469.41 | 502.85 |
January 2027 | 431.79 | 463.98 | 496.17 |
February 2027 | 468.57 | 485.29 | 502.02 |
March 2027 | 471.92 | 493.66 | 515.40 |
April 2027 | 514.56 | 528.77 | 542.99 |
May 2027 | 524.59 | 548.42 | 572.25 |
June 2027 | 546.33 | 569.49 | 590.65 |
Long-Term Trading Plan for #TSLA for 2026
The technical analysis conducted has revealed key support and resistance levels that can be used in a trading strategy for the coming year.
Trading Plan for the Year
- Tesla's stock price is expected to rise in the near future.
- Key support levels: $378.85, $358.39, $337.41, $314.91, $297.00, $275.52, $250.45, $231.52, $214.13, $191.62, $170.65, and $150.19.
- Key resistance levels: $415.17, $435.12, $453.53, $472.97, $499.06, $518.71, $537.19, $556.18, $575.69, and $594.68.
- Base scenario: Open long trades above the key resistance level of $415.17 on increased volume or when the price rebounds from the $378.85 level. Potential targets are in the $435.12–$594.68 range.
- Alternative scenario: Open short trades below the key support level of $378.85 on increased volume, targeting the $358.39–$150.19 range.
Analysts' TSLA Price Projections for 2026
The outlook for the Tesla stock in 2026 remains largely positive. Analysts expect TSLA to trade between $427.00 and $502.94 through the year. This growth will be driven by sales of the updated Model Y, as well as advancements in the company's autonomous driving and energy businesses.
LongForecast
Price range: $339.00–$492.00.
LongForecast predicts no clear trend for Tesla in the second half of the year. The price is expected to close at $445.00 in July, drop to $432.00 by the end of Q3, and settle at $427.00 by December.
Month | Min–Max, $ | Close, $ |
July | 339.00–481.00 | 445.00 |
August | 420.00–492.00 | 456.00 |
September | 397.00–467.00 | 432.00 |
October | 372.00–436.00 | 404.00 |
November | 375.00–441.00 | 408.00 |
December | 393.00–461.00 | 427.00 |
WalletInvestor
Price range: $394.03–$518.53.
WalletInvestor anticipates a gradual rise in the stock price. The asset is projected to trade at $421.72 in July, climb to $454.10 by the end of September, and hit a high of $518.53 by December.
Month | Open, $ | Close, $ | Minimum, $ | Maximum, $ |
July | 405.80 | 421.72 | 394.03 | 433.95 |
August | 422.25 | 438.18 | 409.59 | 451.33 |
September | 438.71 | 454.10 | 429.06 | 464.10 |
October | 454.64 | 470.56 | 438.27 | 487.50 |
November | 471.09 | 486.49 | 461.20 | 496.70 |
December | 487.02 | 502.94 | 471.92 | 518.53 |
CoinCodex
Price range: $197.69–$538.50.
CoinCodex forecasts that Tesla shares will trade near their annual highs in the second half of the year, with the average price expected to be $505.59 in July. However, a correction may occur in the autumn, dragging the price down to $227.50 by December.
Month | Minimum, $ | Average, $ | Maximum, $ |
July | 445.43 | 505.59 | 538.50 |
August | 472.13 | 506.40 | 536.86 |
September | 374.28 | 439.44 | 538.28 |
October | 321.67 | 362.93 | 403.59 |
November | 267.98 | 307.38 | 340.07 |
December | 197.69 | 227.50 | 262.28 |
Analysts' TSLA Price Projections for 2027
Forecasts for 2027 vary significantly. Some analysts expect Tesla to continue its steady growth, while others anticipate a more subdued momentum. The stock price may be influenced by developments in Full Self-Driving technology, demand for the Cybertruck, and the pace of the company's production capacity expansion.
Note: The price ranges reflect the asset's expected volatility throughout the year. Lows and highs may not be shown in the summary tables.
LongForecast
Price range: $398.00–$905.00.
LongForecast estimates that Tesla will trade in an uptrend. The price is expected to close at $499.00 in Q1 and reach a high of $838.00 by December. Volatility is expected to be elevated.
Quarter | Min–Max, $ | Close, $ |
Q1 | 398.00–539.00 | 499.00 |
Q2 | 499.00–618.00 | 572.00 |
Q3 | 572.00–758.00 | 702.00 |
Q4 | 670.00–905.00 | 838.00 |
WalletInvestor
Price range: $493.40–$715.51.
WalletInvestor projects moderate gains for TSLA. The price is predicted to close at $550.72 in Q1, advance to $599.02 by mid-year, and hit a high of $715.51 in December.
Quarter | Open, $ | Close, $ | Minimum, $ | Maximum, $ |
Q1 | 503.47 | 550.72 | 493.40 | 567.79 |
Q2 | 551.25 | 599.02 | 529.20 | 616.40 |
Q3 | 599.56 | 647.86 | 586.37 | 672.48 |
Q4 | 648.39 | 696.70 | 628.94 | 715.51 |
CoinCodex
Price range: $189.98–$511.44.
According to CoinCodex, the average price may rise to $448.43 by Q3. By year-end, a correction may unfold, with the average price reaching $430.36. High volatility is expected.
Quarter | Minimum, $ | Average, $ | Maximum, $ |
Q1 | 189.98 | 326.47 | 367.60 |
Q2 | 272.72 | 424.75 | 466.44 |
Q3 | 377.38 | 448.43 | 511.44 |
Q4 | 348.26 | 430.36 | 462.04 |
Analysts' TSLA Price Projections for 2028
The outlook for 2028 is optimistic. The stock may be supported by the development of robotaxi services, rising sales of electric vehicles, and the expansion of the energy storage business.
LongForecast
Price range: $838.00–$1,339.00.
LongForecast anticipates strong growth in the first half of the year. The stock price is projected to reach $1,070.00 by the end of Q1, hit a high of $1,207.00 by summer, and then undergo a correction, settling at around $916.00 by December.
Quarter | Min–Max, $ | Close, $ |
Q1 | 838.00–1,156.00 | 1,070.00 |
Q2 | 976.00–1,304.00 | 1,207.00 |
Q3 | 970.00–1,339.00 | 1,080.00 |
Q4 | 843.00–1,105.00 | 916.00 |
WalletInvestor
Price range: $546.81–$1,345.00.
According to WalletInvestor, Tesla's stock price will increase gradually. The price is expected to average at $690.25 in Q1 and reach a high of $1,345.00 by year-end.
Quarter | Minimum, $ | Average, $ | Maximum, $ |
Q1 | 546.81 | 690.25 | 715.27 |
Q2 | 655.17 | 904.85 | 965.17 |
Q3 | 894.54 | 1,239.66 | 1,314.88 |
Q4 | 1,079.53 | 1,261.00 | 1,345.00 |
CoinCodex
Price range: $247.17–$817.27.
CoinCodex anticipates an uptrend for TSLA. The most significant gains are expected in the second half of the year. The price is estimated to peak at $817.27 by the end of December. Experts forecast high volatility.
Quarter | Minimum, $ | Average, $ | Maximum, $ |
Q1 | 284.61 | 306.51 | 434.55 |
Q2 | 247.17 | 320.07 | 372.39 |
Q3 | 342.47 | 409.22 | 456.40 |
Q4 | 376.76 | 719.15 | 817.27 |
Analysts' TSLA Price Projections for 2029
Most analysts expect Tesla's stock to extend its bullish trend. The development of robotaxis, increased revenue from software, and the expansion of the company's global market presence are likely to be the main drivers of growth.
LongForecast
Price range: $825.00–$1,290.00.
LongForecast suggests Tesla may rise to $1,145.00 in the first half of the year, soar to a high of $1,290.00 in the autumn, and decline to $932.00 by December.
Quarter | Min–Max, $ | Close, $ |
Q1 | 825.00–1,035.00 | 897.00 |
Q2 | 897.00–1,237.00 | 1,145.00 |
Q3 | 914.00–1,290.00 | 1,194.00 |
Q4 | 856.00–1,194.00 | 932.00 |
WalletInvestor
Price range: $1,079.85–$1,614.17.
Experts at WalletInvestor predict that TSLA will continue to appreciate. The price is expected to average at $1,298.59 in Q1 and reach a high of $1,485.98 by year-end.
Quarter | Minimum, $ | Average, $ | Maximum, $ |
Q1 | 1,079.85 | 1,298.59 | 1,386.18 |
Q2 | 1,212.69 | 1,368.79 | 1,548.48 |
Q3 | 1,142.23 | 1,290.97 | 1,434.08 |
Q4 | 1,256.58 | 1,485.98 | 1,614.17 |
CoinCodex
Price range: $397.74–$851.41.
According to CoinCodex, Tesla's stock price will trade in a moderate uptrend, averaging at $562.02 by summer and peaking at $851.41 by December.
Quarter | Minimum, $ | Average, $ | Maximum, $ |
Q1 | 398.16 | 443.61 | 746.40 |
Q2 | 397.74 | 562.02 | 628.78 |
Q3 | 511.46 | 695.54 | 780.97 |
Q4 | 689.65 | 806.33 | 851.41 |
Analysts' TSLA Price Projections for 2030
The outlook for 2030 is upbeat. The stock price will largely depend on Tesla's position in the electric vehicle market, the progress of self-driving vehicles, and the company's energy business.
WalletInvestor
Price range: $1,175.51–$1,863.67.
WalletInvestor expects the stock price to continue climbing. The price is projected to average at $1,477.57 in Q1 and surge to a high of $1,863.67 by year-end.
Quarter | Minimum, $ | Average, $ | Maximum, $ |
Q1 | 1,374.45 | 1,477.57 | 1,661.49 |
Q2 | 1,175.51 | 1,542.26 | 1,758.69 |
Q3 | 1,468.57 | 1,528.34 | 1,830.78 |
Q4 | 1,421.65 | 1,767.69 | 1,863.67 |
CoinCodex
Price range: $440.14–$850.94.
CoinCodex predicts that Tesla shares will rise throughout most of the year. The price is forecast to average at $809.55 by Q3 and slide to a low of $440.14 by December.
Quarter | Minimum, $ | Average, $ | Maximum, $ |
Q1 | 629.15 | 678.05 | 785.93 |
Q2 | 598.16 | 702.90 | 778.23 |
Q3 | 674.86 | 809.55 | 850.94 |
Q4 | 440.14 | 531.78 | 769.92 |
StockScan
Price range: $353.43–$958.40.
StockScan maintains an optimistic outlook for TSLA. The price is anticipated to average at $492.66 in Q1, exceed $647.91 by summer, and reach a high of $958.40 by December.
Quarter | Minimum, $ | Average, $ | Maximum, $ |
Q1 | 353.43 | 492.66 | 493.34 |
Q2 | 503.55 | 647.91 | 648.04 |
Q3 | 658.17 | 806.91 | 808.29 |
Q4 | 819.30 | 956.04 | 958.40 |
Analysts' TSLA Price Projections until 2050
The long-term outlook for the Tesla stock is optimistic. However, such forecasts are highly uncertain. The value of TSLA could be influenced by developments in autonomous vehicle technology, the state of the global electric vehicle market, competition, and changes in industry regulations.
According to StockScan, Tesla's stock price will continue to increase, reaching $4,644.93 by 2040 and $5,878.37 by 2050.
CoinPriceForecast expects the stock price to appreciate in the long term as well. According to the forecast, the asset may rise to $1,176.00 by the end of 2035 and to $1,298.00 by 2037.
Year | StockScan, $ | CoinPriceForecast, $ |
2035 | 3,612.22 | 1,176.00 |
2037 | - | 1,298.00 |
2040 | 4,644.93 | - |
2045 | 5,440.78 | - |
2050 | 5,878.37 | - |
TSLA (Tesla) Market Sentiment on Social Media
Sentiment on social media can influence TSLA's short-term price movements. Positive news about new products, technologies, or the company's financial results can boost demand for the stock. Negative news, on the other hand, can heighten volatility and lead to price declines.
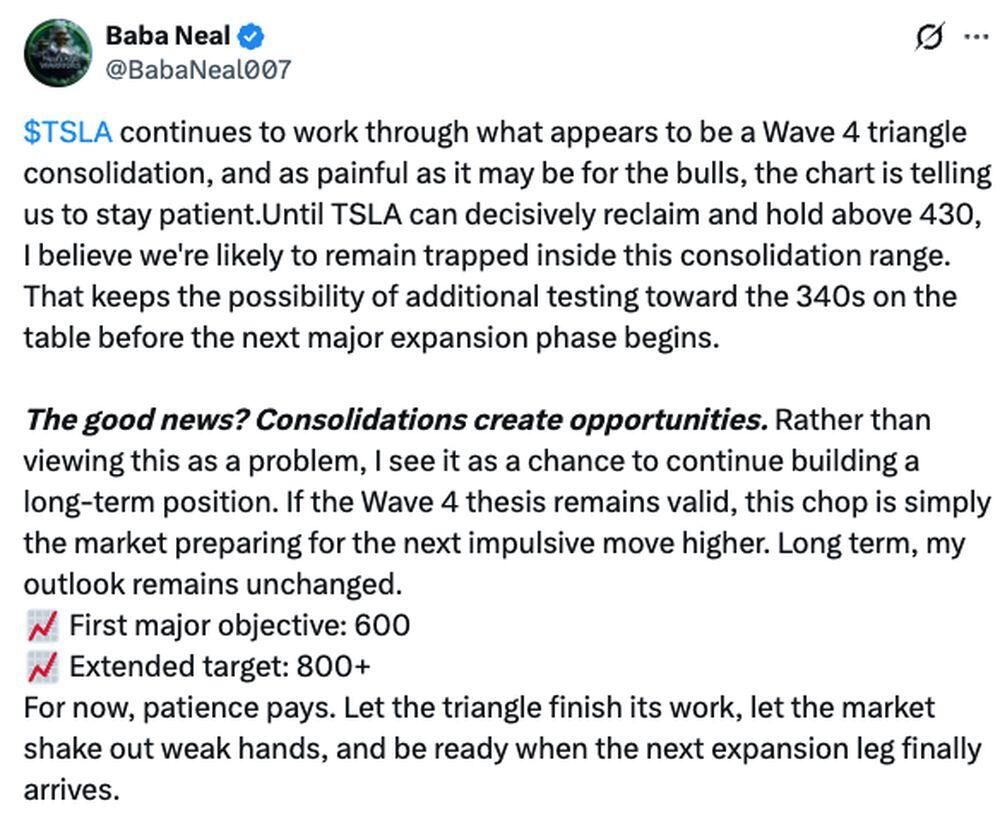
User @BabaNeal007 expects TSLA to rise to the $600.00–$800.00 range in the long term, provided the price settles above $430.00.
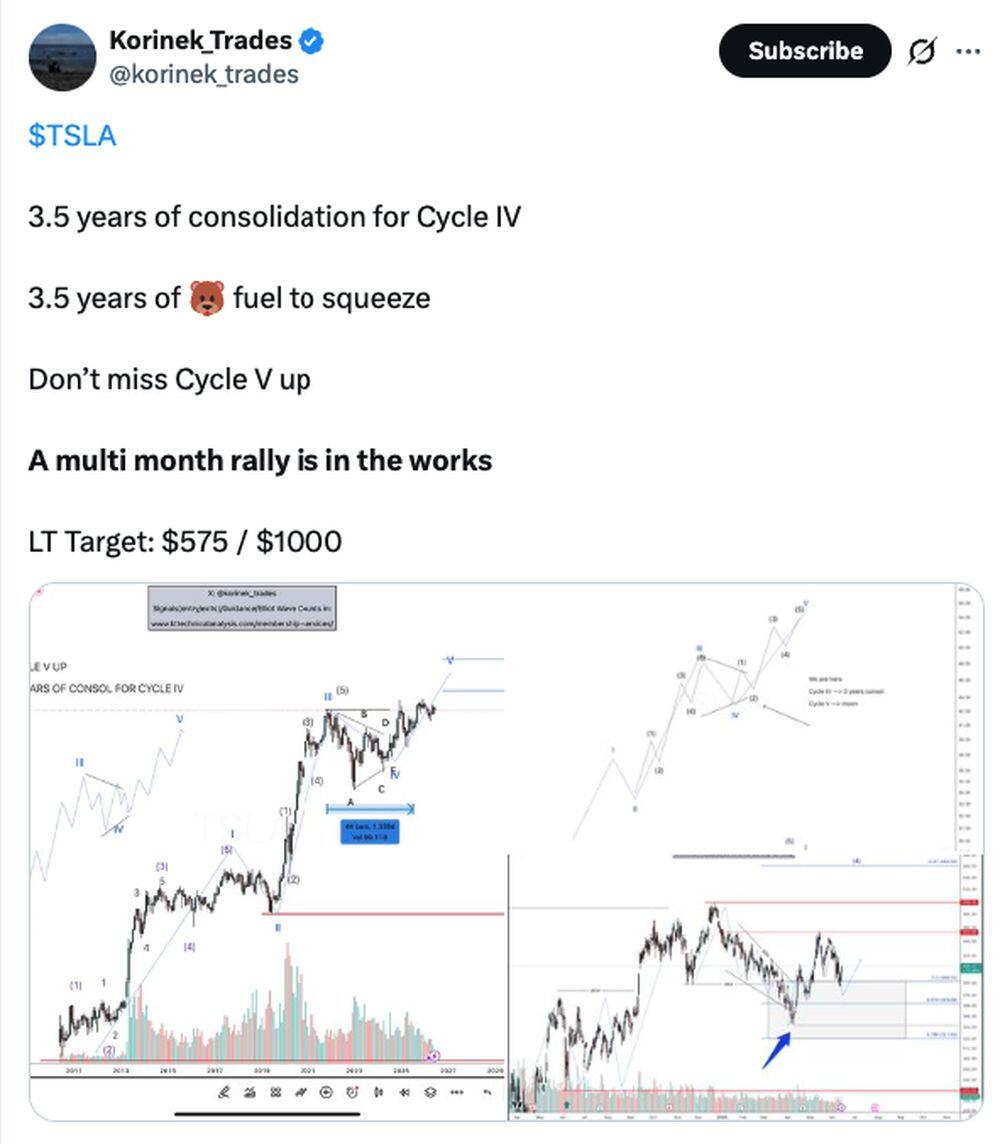
Independent expert @korinek_trades forecasts an increase to $575.00–$1,000.00 in the long term.
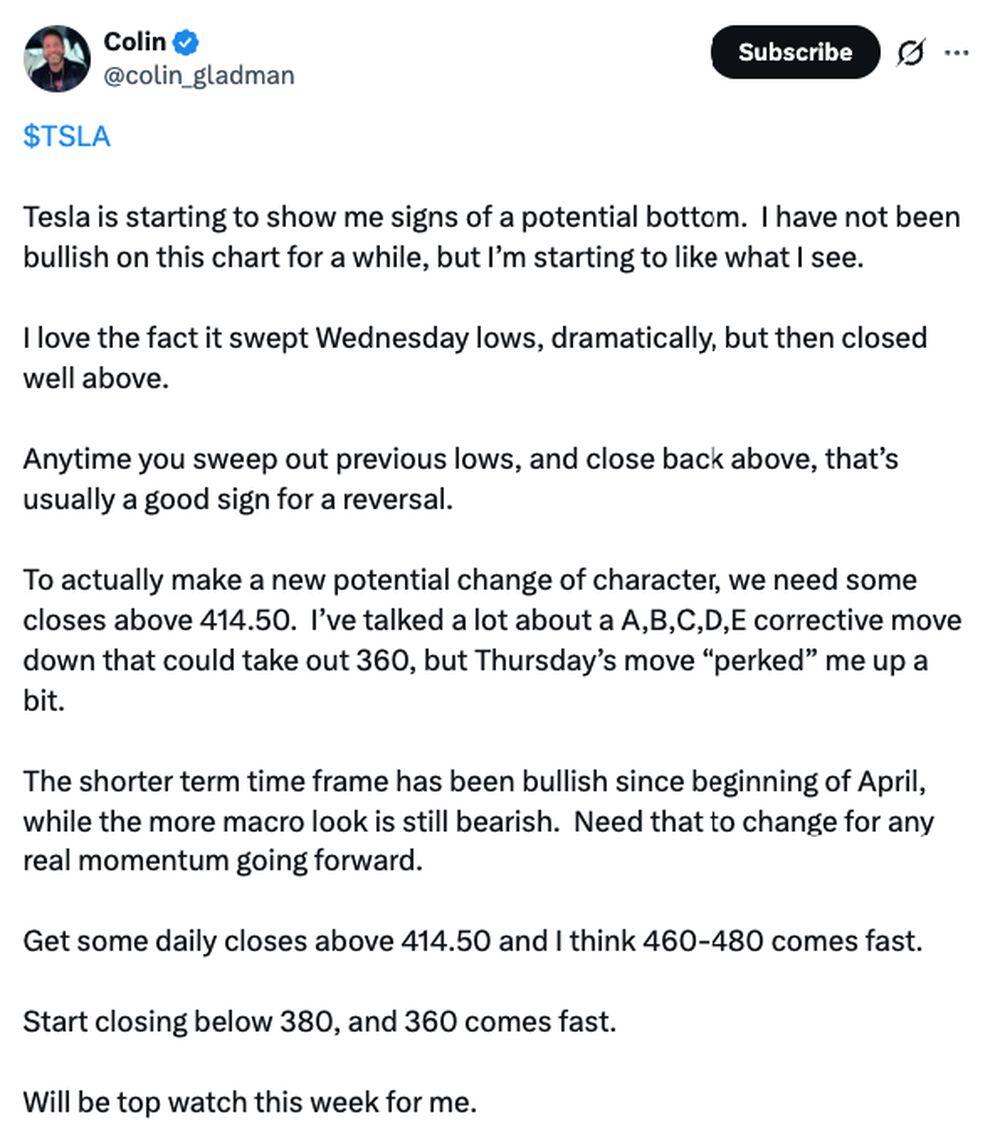
Independent investor @colin_gladman predicts that TSLA's price may climb to $460.00–$480.00 if it manages to settle above $414.50.
Most investors and traders view the medium- and long-term outlook for Tesla stock positively. However, you should conduct technical and fundamental analysis and review the latest expert insights before making any trading or investment decisions.
TSLA Price History
Tesla (TSLA) reached the highest price of $498.46 on 22.12.2025.
The lowest price of Tesla (TSLA) was recorded on 07.07.2010 when the stock declined to $0.99.
It is essential to evaluate historical data to ensure our forecasts are as accurate as possible. Below is a chart of TSLA's performance over the last ten years.
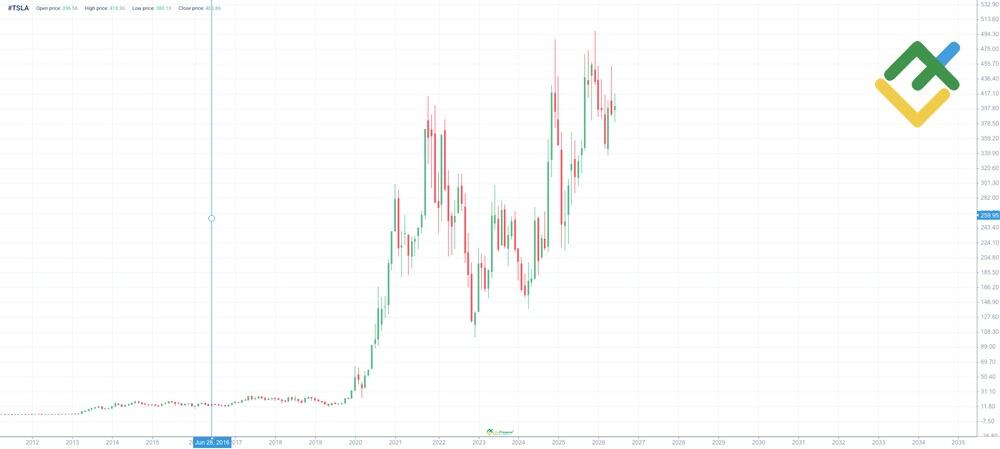
- In 2020, Tesla shares soared due to growing demand for electric vehicles.
- In 2021, the upward trend continued, with shares reaching a high thanks to their inclusion in the S&P 500 index and solid financial results.
- In 2022, the price declined due to concerns about the global economy, supply chain issues, and competition.
- In 2023–2024, Tesla shares traded in a wide range, reflecting a balance between innovation and macroeconomic risks.
- Since January 2025, TSLA's share price has shown considerable volatility, influenced by news about deliveries, developments involving Elon Musk, and broader macroeconomic factors. The price climbed to $367.60 in the spring but fell to $288.74 in July amid component supply disruptions. In mid-summer, the momentum stabilized, and the asset reached higher levels in the autumn. At the end of 2025, TSLA shares soared to the historical high of $489.36 amid news of robotaxi testing.
- In January 2026, a downtrend started. By April, the price had fallen to $337.22 amid supply news and macroeconomic data. By May, the price had climbed to $453.23. However, a correction began soon after.
TSLA Shares Fundamental Analysis
Like other financial instruments, TSLA's stock price is influenced by numerous macroeconomic and geopolitical factors.
- Financial performance. Strong earnings reports bolster confidence among major market players in Tesla Inc.'s long-term growth prospects. Consistently rising profits suggest high demand for the company's products, attracting new investors.
- High competition in the electric car industry. Chinese automakers' rapid growth is putting pressure on Tesla in the global market, as prices for cars from China are nearly half of Tesla's.
- Innovative technologies. On the one hand, large investments in technologies, including AI, make investors wary. On the other hand, they highlight the company's large-scale development prospects.
- Geopolitical factors. Various armed conflicts force investors to hedge their risks with precious metals and other safe-haven assets. This reduces the popularity of stocks, including TSLA, and the asset's value may decline.
- Macroeconomic factors. The trade war between the US and China significantly impacts the stock market. Sanctions and higher trade tariffs to protect domestic markets directly affect electric vehicle production and Tesla's stock price.
- Elon Musk's statements. TSLA's high volatility is partly due to the activity of Tesla Inc.'s founder on various social media platforms, particularly X. The entrepreneur's high-profile statements have repeatedly caused major fluctuations in TSLA's price.
More Facts About TSLA
Tesla Inc. was founded in 2003 and is headquartered in Austin, Texas. In addition to producing, repairing, and servicing vehicles, the company designs and installs solar energy generation and storage devices.
Tesla Inc. gained popularity thanks to its innovative approach to automotive engineering. Autonomous driving, robotaxis, and other AI-based technologies are how the company imagines the industry's future.
However, due to the high cost of these innovations, the company's stock remains quite volatile, attracting numerous traders. TSLA shares offer opportunities for profit in both the short and long term.
Year over year, the company's revenues and capitalization continue to grow. Tesla remains dynamic, developing in a highly competitive environment, making it popular among market participants.
Advantages and Disadvantages of Investing in TSLA
This section examines the advantages and disadvantages of investing in the TSLA stock.
Advantages
- Full production cycle. Controlling the entire production process, from raw materials and software to the final product and the charging network, makes it hard for competitors to enter the market and helps the company remain efficient over the long term, even when market conditions change.
- Historical performance of TSLA stock prices. Positive financial earnings reports indicate increasing demand for the company's products and its steady development. The company's market capitalization is also growing, showing Tesla's substantial potential.
- The company's investments in innovative technology development. Now, the company plans to produce autonomous vehicles and robotaxis. Additionally, the global shift to green energy will support TSLA's growth.
Disadvantages
- High production costs for electric vehicles greatly boost Tesla's vehicle prices. This, in turn, may negatively impact the company's revenue, profit, and stock value.
- The company's costly innovations may also harm Tesla's stock. Increasingly, Chinese companies are entering the market with more affordable electric cars, already challenging Tesla's position. Large expenditures on innovation may not pay off, potentially leading to worsening financial results for Tesla and, consequently, affecting the company's stock price.
- High volatility enables traders and investors to achieve quick profits, but it also carries a high risk of losing investments. Therefore, before making trading decisions on TSLA stock, it's essential to conduct a thorough fundamental and technical analysis.
How We Make Forecasts
The key components in forecasting various trading instruments, including the TSLA stock, are:
1. Fundamental analysis involving:
- evaluating forecasts from leading analysis agencies;
- assessing the company's financial condition (market capitalization, income/expenses, earnings per share, business profitability, return on investment, and much more);
- analyzing the news environment around the company;
- examining geopolitical and macroeconomic factors that may affect the company's stock price.
2. Technical analysis. A more successful conservative research model combines candlestick, chart, and indicator analysis. Signals from various technical tools help identify the most advantageous entry points and determine optimal profit targets.
Conclusion: Is TSLA a Good Investment?
Tesla stock has significant growth potential due to the company's leadership in advanced sectors of the economy. Innovative technologies, a strong brand, and an ambitious CEO make the company attractive to growth-oriented investors. However, investing in this asset also involves a high level of risk. Volatility, dependence on market sentiment, and potential technological breakthroughs by competitors may negatively impact the stock price.
Before making any investment decisions, it is essential to carefully assess potential risks and adopt a long-term strategy. At the same time, building a well-diversified portfolio by including shares of other promising companies can help manage risk more effectively.
TSLA Price Prediction FAQ
The current TSLA price is trading at $313.03 as of 25.07.2026.
Forecasts for Tesla's stock price are uncertain due to market volatility and the company's technological innovations. Analysts are divided in their opinions, but most expect the price to rise to $427.00–$502.94 by the end of the year.
The company remains a leader in the electric vehicle industry, although global competition is steadily intensifying. When evaluating its prospects, it is important to consider both its financial performance and long-term growth strategy. TSLA stocks could be an attractive investment opportunity, especially in light of the recent SpaceX IPO.
Over the past 52 weeks, Tesla shares have traded between $288.77 and $498.83. While new product launches and technological advancements have fueled optimism, concerns over the US macroeconomic environment and growing competition in the EV market have periodically weighed on the stock.
Forecasts for the Tesla stock in 2027 suggest an increase to between $696.70–$838.00, driven by expanded production, entry into new markets, and advancements in self-driving technology. However, market fluctuations and external factors can affect the stock price at any time.
Forecasts for Tesla's stock price in five years take into account a number of factors, including the company's growth rate, the development of infrastructure for electric vehicles, and changes in government policy. The price of TSLA is expected to range from $956.04 to $1,767.69.
Long-term forecasts for Tesla are speculative. The company is expected to become a key player in the electric vehicle and energy solutions sectors. The consensus forecast among experts is for the stock to rise to $956.04–$1,767.69.
TSLA's growth prospects depend on a variety of factors, including production performance, technological innovation, competition, and macroeconomic conditions. If the company can successfully scale up production, develop new technologies, and maintain its competitive advantages, its shares are likely to rise.
The decision to buy, sell, or hold TSLA shares depends on your strategy. It is necessary to consider the current market situation, the company's financial health, and your own investment goals, and to conduct technical and fundamental analysis before making any decisions. The expert consensus recommendation is to buy.
Price chart of TSLA in real time mode

The content of this article reflects the author’s opinion and does not necessarily reflect the official position of LiteFinance broker. The material published on this page is provided for informational purposes only and should not be considered as the provision of investment advice for the purposes of Directive 2014/65/EU.
According to copyright law, this article is considered intellectual property, which includes a prohibition on copying and distributing it without consent.