Forecasting the USCrude price requires taking into account fundamental, geopolitical, and technical factors. The dynamics of crude oil not only shape the global economic environment but also depend heavily on exporting countries' decisions, macroeconomic indicators, and unexpected events.
In this review, we will examine the outlook for oil prices over the upcoming trading sessions, assess prospects for the week ahead, and outline key benchmarks for the coming month. The forecast takes into account the current supply-demand balance, speculative positioning, and the latest geopolitical developments.
The article covers the following subjects:
- Expert Technical Analysis for USCrude for Today
- USCrude Real-Time Market Status
- Oil Price Forecast for Tomorrow
- Oil Price Forecast for Next Week
- Oil Price Prediction for Next 30 Days
- USCrude Outlook: Market Sentiment and Key Events for the Next 30 Days
- Price Analysis and Forecasting Methodology
- Oil (USCrude) Price Forecast FAQs
Expert Technical Analysis for USCrude for Today
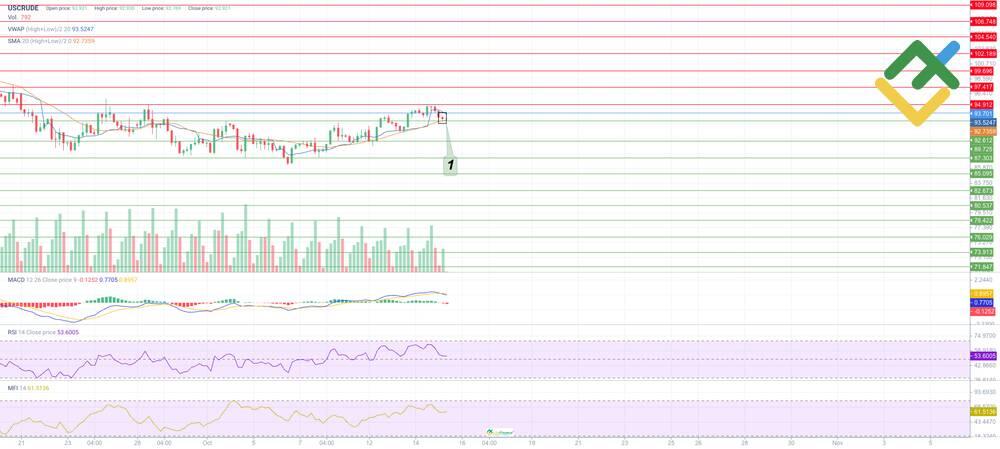
The 4-hour chart shows the following signals:
A Hammer candlestick pattern (1) has formed near support at $92.61, signaling a potential resumption of the uptrend after a correction.
The MACD indicator is declining in negative territory, indicating that bullish momentum is fading.
The RSI is holding near 53 in neutral territory, suggesting the price may move in either direction.
The MFI is moving sideways, providing no clear buy or sell signals.
The VWAP and SMA20 are near the market price, suggesting a temporary balance between buyers and sellers.
Trading Plan for USCrude for Today
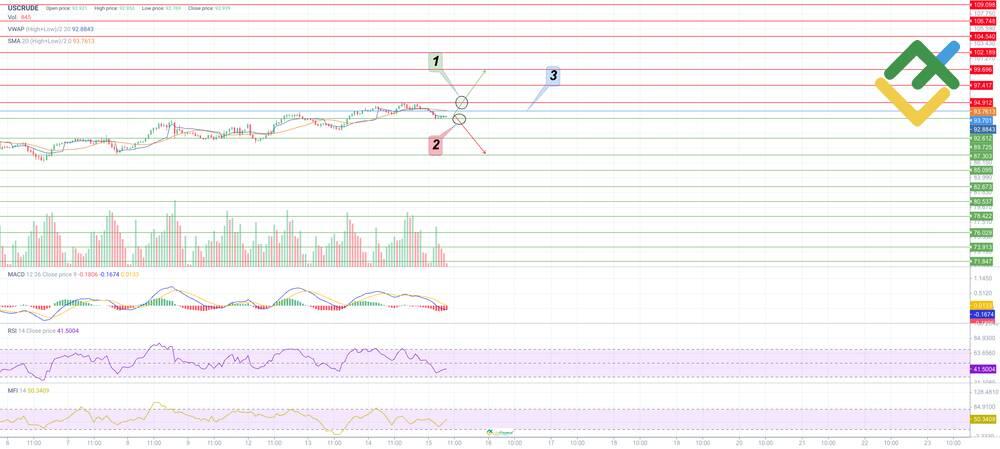
Oil forecast for today:
Key support levels: $92.61, $89.72, $87.30, $85.09, $82.67, $80.53, $78.42, $76.02, $73.91, $71.84.
Key resistance levels: $94.91, $97.41, $99.69, $102.18, $104.54, $106.74, $109.09.
Base scenario: Open long positions (1) above $94.91 on increased volume. Targets: $97.41, $99.69, $102.18, $104.54, $106.74, and $109.09. Stop Loss (3): $93.70.
Alternative scenario: Open short positions (2) on increased volume below $92.61, with price targets at $89.72, $87.30, $85.09, $82.67, $80.53, $78.42, $76.02, $73.91, and $71.84. Stop Loss (3): $93.70.
The analysis is provided by Alan Tsagaraev.
Alan Tsagaraev is an independent trader and analyst specializing in stock, foreign exchange, and cryptocurrency markets. He holds a degree in Economics and has been a professional investor and financial market trader since 2019. Over the course of his career, he has increased his capital more than tenfold.
USCrude Real-Time Market Status
USCrude is trading at $96.121 as of 16.10.2026.
Oil Price Forecast for Tomorrow
On October 16, 2026, USCrude prices may continue to rise.
USCRUDE price prediction tomorrow:
Date | Daily Low, $ | Average Price, $ | Daily High, $ |
16.10.2026 | 87.30 | 93.49 | 99.69 |
Oil Price Forecast for Next Week
USCRUDE is expected to be volatile this week as the market reacts to the release of OPEC's monthly report, ADP's weekly employment data, the IEA's monthly report, September's Consumer Price Index (CPI), the Fed's Beige Book, the API's weekly crude oil inventory data, and other macroeconomic indicators. Any escalation of the conflict in the Middle East could add to market volatility.
USCRUDE price prediction this week:
Date | Weekly Low, $ | Average Price, $ | Weekly High, $ |
12.10.2026–18.10.2026 | 76.02 | 89.10 | 102.18 |
Oil Price Prediction for Next 30 Days
In October 2026, WTI crude oil is forecast to trade in the $71.57–$100.86 range. Key factors include escalating geopolitical tensions, lower crude oil supply, and tighter Fed monetary policy.
USCrude price prediction 30 days:
Month | Monthly Low, $ | Average Price, $ | Monthly High, $ |
October | 71.57 | 86.21 | 100.86 |
USCrude Outlook: Market Sentiment and Key Events for the Next 30 Days
The following factors may affect the price of USCrude:
- Major financial institutions, including Standard Chartered, have significantly revised their forecasts upward amid market instability, pushing the average 2026 target for WTI to $86.00 and for Brent to $92.00.
- In its September STEO, the EIA expects Brent to average $91.00 and WTI to average $84.00 in the fourth quarter of 2026.
- The conflict between the US and Iran remains a key factor supporting high oil prices. Talks aimed at finding a diplomatic solution to the shipping situation in the Persian Gulf have failed to produce results. Market participants are pricing the persistent threat of direct military action and strikes on oil infrastructure into October contracts.
- By the end of September, the US Department of Energy reported an unexpected 1.02 million-barrel increase in commercial crude oil inventories, slightly curbing the speculative rally. If inventories continue to rise in October, WTI's upside potential may be limited to $95.00.
- Meanwhile, US diesel and fuel oil inventories have fallen below 100 million barrels, 14% below the five-year low. High refining margins are prompting US refineries to operate near full capacity and actively purchase WTI. This may support further price growth.
- The US Strategic Petroleum Reserve has already been used for interventions, with up to 40 million barrels released. Washington's ability to influence prices through its reserves will be significantly limited in October.
- US oil production has reached record highs of 13.83–13.86 million barrels per day. The US shale industry is partially replacing lost supplies from the Middle East and preventing OPEC+ from fully controlling the WTI market.
- China has accumulated significant undisclosed oil reserves. During the summer and September, Chinese state-owned companies reduced spot-market purchases, limiting the global rise in oil prices. However, Nomisma Energia experts note that these reserves are not unlimited and that China will have to increase imports again in October.
- High central bank interest rates continue to weigh on the global economy. Slower economic activity is reducing overall fuel demand.
- October 15 — September retail sales, September Producer Price Index (PPI), and October Philadelphia Fed Manufacturing Index.
- October 16 — September industrial production data and the US Baker Hughes Total Rig Count.
- October 28 — Fed interest rate decision.
Price Analysis and Forecasting Methodology
Our daily Oil price analysis and forecasting methodology includes:
- Analysis of fundamental factors and expert opinions influencing USCrude short-term price movements.
- Technical analysis of the asset's charts from H1 to H4 time frames, including identification of key support and resistance levels, examination of technical indicators, and study of candlestick and chart patterns.
- Assessment of market sentiment through the analysis of posts and comments on social media, offering insights into the oil price's next move.
Oil (USCrude) Price Forecast FAQs
Short-term oil price movements depend on incoming news, US inventory data, and geopolitical events. The key support and resistance levels for tomorrow are projected at $87.30 and $99.69, respectively. Technical indicators and candlestick patterns are mostly bullish. Oil prices are likely to rise.
Next week, OPEC and the International Energy Agency (IEA) will publish monthly reports, and September US CPI data will be released along with other macroeconomic indicators. In the positive scenario, the price may rise to $102.18 or higher. In the negative scenario, it may fall to $76.02.
Throughout the month, the key driver will be the supply-demand balance. The main factors include escalating geopolitical tensions, slower oil exports from Middle Eastern countries, and a more hawkish Fed stance. WTI is expected to trade in the $71.57–$100.86 range.
Short-term declines may occur if US commercial inventories rise unexpectedly, OPEC+ decides to increase production, macroeconomic data weaken, or the market undergoes a technical correction after a strong rally.
Price chart of USCRUDE in real time mode

The content of this article reflects the author’s opinion and does not necessarily reflect the official position of LiteFinance broker. The material published on this page is provided for informational purposes only and should not be considered as the provision of investment advice for the purposes of Directive 2014/65/EU.
According to copyright law, this article is considered intellectual property, which includes a prohibition on copying and distributing it without consent.