Gold is popular among investors and often serves as a "safe haven", a financial asset that helps preserve capital during economic instability. Forecasting the price of this instrument requires a comprehensive analysis of economic, political, and financial factors, as well as market trends and macroeconomic conditions.
In this article, we will examine the price history of XAU/USD and insights from professional analysts to develop scenarios for gold prices in 2026, 2027, 2028, and beyond.
The article covers the following subjects:
- Major Takeaways
- Gold Real-Time Market Status
- Gold Weekly Price Forecast as of 27.07.2026
- Gold Price Forecast for 2026 Based on Technical Analysis
- Analysts' XAUUSD Price Projections for 2027
- Analysts' XAUUSD Price Projections for 2028
- Analysts' XAUUSD Price Projections for 2029
- Analysts' XAUUSD Price Projections for 2030
- Analysts' XAUUSD Price Projections until 2050
- XAUUSD (Gold) Market Sentiment on Social Media
- Gold Price History (XAU/USD)
- Gold Price Fundamental Analysis (XAU/USD)
- More Facts About Gold
- How We Make Forecasts
- Conclusion: Is Gold a Good Investment?
- Gold Price Prediction FAQ
Major Takeaways
- The current gold price is trading at $4 077.14 as of 30.07.2026.
- Gold reached an all-time high of $5595.42 on 29.01.2026. The all-time low was hit on 25.08.1999, when the asset declined to $252.55.
- Expert forecasts for the second half of 2026 are uncertain. Some analysts predict the gold price will rise to $4,305.92 by December. Pessimistic forecasts suggest a bearish trend could push prices down to the $3,578.00–3,288.22 range.
- According to some platforms, the XAUUSD price may grow to $5,369.36–$5,696.00 in 2027. Other experts project a bearish movement to $2,184.36.
- Analysts offer mixed forecasts for 2028–2030. Some experts believe the asset will trade between $7,166.41 and $9,406.67. Pessimistic forecasts indicate that the metal could reach $2,814.92 by 2030.
- Long-term forecasts for 2040–2050 are more uncertain due to the many different factors affecting this precious metal. Nevertheless, analysts view gold's outlook positively and predict that the price will soar to $14,329.00 by 2037.
- According to technical analysis, last week, gold fell to the first bearish target of $4,054. The next target is $3,943.
Gold Real-Time Market Status
The current gold price as of 30.07.2026 is $4 077.14.
To assess the current state of the precious metal, the following metrics should be analyzed:
- Year-over-Year Inflation Rate (US) is determined based on the Consumer Price Index (CPI), which measures changes in the prices of goods and services.
- Interest Rate (US): The cost of borrowing funds, expressed as a percentage of the borrowed amount. It impacts investment and consumer spending.
- 52-Week Range: The highest and lowest prices of the asset over the past year.
- Yearly Change: The asset price change over the past year.
- Fear and Greed Index: A real-time indicator reflecting investor sentiment and expectations about market conditions.
Indicator | Value (US) |
US Inflation Rate y/y | 3.5% |
US Interest Rate | 3.75% |
52-Week Range | $3,268.15–$5,595.46 |
Yearly Change | 21.45% |
Recommendation | Strong Sell |
All-Time High | $5595.42 |
Gold Weekly Price Forecast as of 27.07.2026
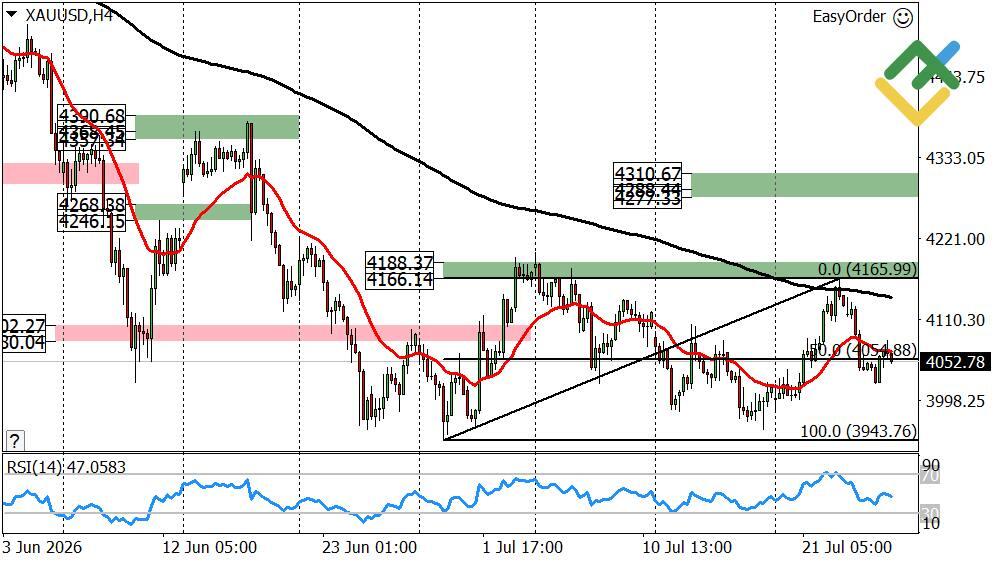
Last week, gold once again experienced an upward correction and tested the resistance A of 4,188–4,166. Bears managed to defend this zone, so the medium-term downtrend persisted, and the asset reached the first bearish target of 4,054.
If the gold price settles below 4,054 this week, it will continue to fall toward the June low of 3,943.
If the price breaks above resistance A, the upward correction will continue, and long trades can be considered.
XAUUSD Trading Ideas for the Week:
Hold part of short trades opened at the resistance A of 4,188–4,166. TakeProfit: 3943. StopLoss: at breakeven.
Technical analysis based on margin zones methodology was provided by an independent analyst, Alex Rodionov.
Gold Price Forecast for 2026 Based on Technical Analysis
Let's conduct technical analysis on the weekly time frame to forecast the XAUUSD price over the medium and long term.
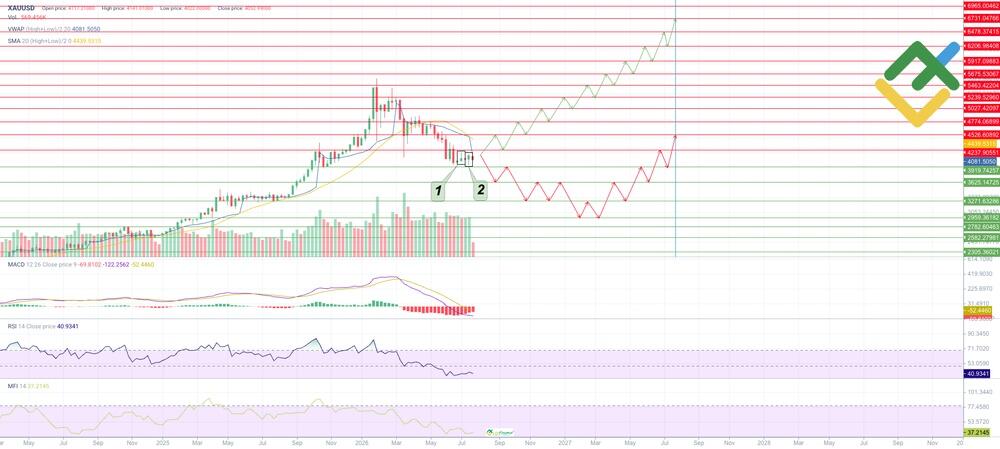
Since late June 2026, the gold price has been consolidating within a narrow range of $3,919.74–$4,237.90. Technical analysis indicators and candlestick patterns offer mixed signals:
- The Inverted Hammer (1) and Hammer (2) candlestick patterns have formed on the weekly chart near the key support level of 3,919.74. The combination of these patterns indicates a potential upward reversal.
- MACD is gradually rising in the negative zone, indicating weakening bearish momentum.
- The RSI is moving sideways near the lower boundary, holding at 40. This means the price may keep dropping, though the chance of an upward reversal is growing.
- The MFI is also moving sideways, indicating low liquidity.
- The VWAP and the SMA20 line are above the market price, indicating that bears still hold the upper hand.
Below is XAUUSD's 12-month price forecast:
Month | Minimum, $ | Average, $ | Maximum, $ |
August 2026 | 3,904.84 | 4,180.91 | 4,456.98 |
September 2026 | 4,251.10 | 4,400.83 | 4,550.56 |
October 2026 | 4,297.17 | 4,536.16 | 4,775.16 |
November 2026 | 4,503.77 | 4,747.08 | 4,990.40 |
December 2026 | 4,737.73 | 4,967.01 | 5,196.29 |
January 2027 | 4,999.76 | 5,126.09 | 5,252.43 |
February 2027 | 5,065.27 | 5,257.11 | 5,448.96 |
March 2027 | 5,140.14 | 5,388.13 | 5,636.12 |
April 2027 | 5,420.88 | 5,654.84 | 5,888.80 |
May 2027 | 5,608.05 | 5,879.44 | 6,150.83 |
June 2027 | 5,879.44 | 6,146.15 | 6,412.86 |
July 2027 | 6,160.19 | 6,417.54 | 6,674.89 |
Long-Term Trading Plan for XAUUSD for 2026
Technical analysis has revealed key support and resistance levels that you can use in your trading strategy for the coming year.
Trading Plan for the Year
- The gold price is likely to rebound in the near future.
- Key support levels: 3,919.74, 3,625.14, 3,271.63, 2,959.36, 2,782.60, 2,585.27, and 2,305.36.
- Key resistance levels: 4,237.90, 4,526.60, 4,774.06, 5,027.42, 5,239.52, 5,463.42, 5,675.53, 5,917.09, 6,206.98, 6,478.37, 6,731.04, and 6,965.00.
- Base long-term scenario: Open long trades above the key resistance level of 4,237.90 or upon a reversal near 3,919.74, targeting 4,526.60–6,965.00. Time horizon: 12 months.
- Alternative long-term scenario: Open short trades below the key support level of 3,919.74 on increased volume, targeting 3,625.14–2,305.36.
Analysts' XAUUSD Price Projections for 2026
According to analysts, the average price of gold will reach $4,305.92 by the end of 2026. The key factors will be demand for the precious metal and the US Fed's monetary policy. Rising global production, a stronger US dollar, and the escalation of the Middle East conflict in the second half of the year may curb the rally. A negative forecast calls for a decline to $3,578.00–3,288.22.
LongForecast
Price range: $3,399.00–$4,342.00.
According to LongForecast, the gold price may stabilize at $4,133.00 in August and slide to $3,845.00 in October. By the end of the year, the bearish trend is projected to persist, with the price dropping to $3,578.00.
Month | Min–Max, $ | Close, $ |
August | 3,715.00–4,342.00 | 4,133.00 |
September | 3,683.00–4,133.00 | 3,877.00 |
October | 3,653.00–4,037.00 | 3,845.00 |
November | 3,623.00–4,005.00 | 3,814.00 |
December | 3,399.00–3,814.00 | 3,578.00 |
WalletInvestor
Price range: $3,961.12–$4,477.21.
WalletInvestor predicts that the average gold price will reach $4,066.02 at the end of August, then rise to $4,170.54 by late October and hit $4,305.92 by year-end.
Month | Minimum, $ | Average, $ | Maximum, $ |
August | 4,032.45 | 4,066.02 | 4,099.59 |
September | 3,961.12 | 4,056.90 | 4,109.85 |
October | 4,009.11 | 4,170.54 | 4,234.95 |
November | 4,153.23 | 4,222.95 | 4,292.67 |
December | 4,208.65 | 4,305.92 | 4,477.21 |
CoinCodex
Price range: $3,087.80–$4,203.00.
CoinCodex forecasts that gold will fluctuate widely in the second half of 2026. In Q3, XAUUSD is expected to trade between $3,584.62 and $4,203.00, closing at $3,810.40 in September. In Q4, analysts predict a bearish trend, with the price closing the year at $3,288.22.
Month | Minimum, $ | Average, $ | Maximum, $ |
August | 3,954.99 | 4,094.87 | 4,203.00 |
September | 3,584.62 | 3,810.40 | 4,082.20 |
October | 3,526.54 | 3,662.84 | 3,765.59 |
November | 3,406.83 | 3,560.66 | 3,676.45 |
December | 3,087.80 | 3,288.22 | 3,525.92 |
Analysts' XAUUSD Price Projections for 2027
Experts are divided on the outlook for gold prices in 2027. Some analysts predict an increase to $5,369.36–$5,696.00 by the end of the year, while others forecast a decrease to $2,184.36. Central banks are expected to continue expanding their reserves, thereby boosting demand. However, a potential US recession could prompt investors to sell gold to meet margin requirements.
Note: The price ranges reflect the asset's expected volatility throughout the year. Lows and highs may not be shown in the summary tables.
LongForecast
Price range: $3,578.00–$5,981.00.
LongForecast expects the asset to climb in the first half of 2027. The price is projected to fluctuate between $3,578.00 and $5,013.00, closing at $4,774.00 in June. In the second half of the year, the asset is predicted to advance further toward $4,770.00–$5,981.00 and close at $5,696.00 in December.
Quarter | Min–Max, $ | Close, $ |
Q1 | 3,578.00–4,311.00 | 4,106.00 |
Q2 | 4,106.00–5,013.00 | 4,774.00 |
Q3 | 4,770.00–5,358.00 | 5,103.00 |
Q4 | 4,832.00–5,981.00 | 5,696.00 |
WalletInvestor
Price range: $4,366.33–$5,557.31.
WalletInvestor predicts a bullish scenario for 2027, albeit with short-term corrections. The average price is expected to reach $5,131.88 by mid-year and advance to $5,369.36 by year-end.
Quarter | Minimum, $ | Average, $ | Maximum, $ |
Q1 | 4,366.33 | 4,810.07 | 4,929.19 |
Q2 | 4,414.58 | 5,131.88 | 5,278.63 |
Q3 | 4,583.16 | 4,927.60 | 5,085.14 |
Q4 | 4,846.02 | 5,369.36 | 5,557.31 |
CoinCodex
Price range: $2,142.16–$3,422.88.
According to CoinCodex, the asset will fluctuate between $2,461.15 and $3,422.88 during the first three quarters of 2027, closing at $2,516.98 in September. In Q4, the price is expected to fall to $2,184.36.
Quarter | Minimum, $ | Average, $ | Maximum, $ |
Q1 | 2,635.66 | 3,007.17 | 3,422.88 |
Q2 | 2,461.15 | 2,610.69 | 3,004.89 |
Q3 | 2,461.42 | 2,516.98 | 2,590.24 |
Q4 | 2,142.16 | 2,184.36 | 2,498.98 |
Analysts' XAUUSD Price Projections for 2028
Experts forecast an uptrend for 2028, with the price expected to range between $5,657.74 and $7,581.00. Inflation accelerated by fiscal stimulus and a weaker dollar may be the main catalysts. A bearish forecast calls for a decline to $2,355.37 by the end of the year.
LongForecast
Price range: $5,480.00–$7,960.00.
LongForecast believes the precious metal will reach $6,030.00 by the end of Q1 2028 and climb to $6,375.00 by mid-year. In the second half of the year, sharp swings are expected with prices ranging from $6,162.00 to $7,960.00. By the end of December, the asset is predicted to stabilize at $7,581.00.
Quarter | Min–Max, $ | Close, $ |
Q1 | 5,480.00–6,432.00 | 6,030.00 |
Q2 | 5,577.00–6,694.00 | 6,375.00 |
Q3 | 6,162.00–7,232.00 | 6,849.00 |
Q4 | 6,657.00–7,960.00 | 7,581.00 |
WalletInvestor
Price range: $4,820.10–$5,977.73.
WalletInvestor projects positive momentum for this trading instrument in 2028. The price is expected to increase to $5,552.23 in the first half of the year and reach $5,657.74 by year-end.
Quarter | Minimum, $ | Average, $ | Maximum, $ |
Q1 | 4,862.83 | 5,054.02 | 5,753.86 |
Q2 | 4,820.10 | 5,552.23 | 5,811.91 |
Q3 | 5,175.94 | 5,407.91 | 5,977.73 |
Q4 | 5,241.55 | 5,657.74 | 5,913.55 |
CoinCodex
Price range: $2,184.86–$2,568.80.
According to CoinCodex, the average price of gold will be $2,335.48 at the end of Q1. In Q2 and Q3, the asset will likely rise to $2,494.67. In Q4, the price is expected to fluctuate between $2,355.37 and $2,479.17, ending at $2,408.62 in December.
Quarter | Minimum, $ | Average, $ | Maximum, $ |
Q1 | 2,184.86 | 2,335.48 | 2,386.42 |
Q2 | 2,311.93 | 2,392.74 | 2,454.73 |
Q3 | 2,293.87 | 2,494.67 | 2,568.80 |
Q4 | 2,355.37 | 2,408.62 | 2,479.17 |
Analysts' XAUUSD Price Projections for 2029
The outlook for 2029 looks optimistic. The average price is expected to range from $5,867.55 to $8,266.00, driven by rising geopolitical risks and the shift away from the US dollar in international transactions. However, rising production may temporarily cool the market. A negative forecast suggests the price will remain around $2,379.37 by the end of the year.
LongForecast
Price range: $7,136.00–$8,709.00.
LongForecast suggests the price will hit $7,639.00 by the end of Q1 2029, rise to $7,864.00 by mid-year, and reach $8,266.00 by year-end.
Quarter | Min–Max, $ | Close, $ |
Q1 | 7,136.00–8,021.00 | 7,639.00 |
Q2 | 7,420.00–8,709.00 | 7,864.00 |
Q3 | 7,332.00–8,423.00 | 7,807.00 |
Q4 | 7,348.00–8,679.00 | 8,266.00 |
WalletInvestor
Price range: $5,248.09–$6,685.85.
Analysts at WalletInvestor predict the bullish rally will continue in 2029. The price is projected to rise to $6,111.27 by mid-year and slide to $5,867.55 by year-end.
Quarter | Minimum, $ | Average, $ | Maximum, $ |
Q1 | 5,248.09 | 5,955.71 | 6,238.14 |
Q2 | 5,505.29 | 6,111.27 | 6,413.96 |
Q3 | 5,806.66 | 6,256.67 | 6,685.85 |
Q4 | 5,465.81 | 5,867.55 | 6,329.69 |
CoinCodex
Price range: $2,223.78–$2,583.38.
Experts at CoinCodex predict the asset will decline from $2,517.81 to $2,271.88 during the first three quarters of 2029. By the end of the year, the price is expected to rebound to $2,379.37.
Quarter | Minimum, $ | Average, $ | Maximum, $ |
Q1 | 2,482.31 | 2,517.81 | 2,583.38 |
Q2 | 2,369.15 | 2,428.38 | 2,569.31 |
Q3 | 2,223.78 | 2,271.88 | 2,397.76 |
Q4 | 2,253.09 | 2,379.37 | 2,434.26 |
Analysts' XAUUSD Price Projections for 2030
By the end of the decade, the gold price may reach $7,166.41–$9,406.67. The key factor is likely to be the digitization of gold assets and the growth of ETFs. Some analysts expect the price to stabilize around $2,814.92 by the end of the year. The upper boundary of the forecast is supported by a structural supply deficit and gold's growing status as a store of value.
WalletInvestor
Price range: $5,672.39–$7,805.26.
According to WalletInvestor, gold will show positive momentum in 2030, and the average price will remain above $6,000.00. Analysts forecast the lowest and highest prices at $5,672.39 and $7,805.26, respectively.
Quarter | Minimum, $ | Average, $ | Maximum, $ |
Q1 | 5,725.00 | 6,154.52 | 6,845.21 |
Q2 | 5,672.39 | 6,646.81 | 7,062.87 |
Q3 | 6,331.51 | 6,730.21 | 7,461.07 |
Q4 | 6,702.77 | 7,166.41 | 7,805.26 |
Gov Capital
Price range: $6,917.43–$11,384.19.
Gov Capital predicts the price of the precious metal will surge to $7,912.38 by the end of Q1 2030. The bullish rally is expected to persist throughout the year, with the price reaching $9,406.67 by the end of December.
Quarter | Minimum, $ | Average, $ | Maximum, $ |
Q1 | 6,917.43 | 7,912.38 | 8,761.71 |
Q2 | 7,121.14 | 8,968.85 | 9,983.01 |
Q3 | 7,955.24 | 10,278.27 | 11,306.09 |
Q4 | 8,402.49 | 9,406.67 | 11,384.19 |
CoinCodex
Price range: $2,410.56–$2,946.32.
CoinCodex forecasts that the average price will reach $2,468.16 by the end of Q1 2030 and rise to $2,857.90 by Q3. However, in Q4, the price may settle around $2,814.92.
Quarter | Minimum, $ | Average, $ | Maximum, $ |
Q1 | 2,427.61 | 2,468.16 | 2,551.06 |
Q2 | 2,410.56 | 2,587.93 | 2,715.82 |
Q3 | 2,642.61 | 2,857.90 | 2,946.32 |
Q4 | 2,757.26 | 2,814.92 | 2,891.69 |
Analysts' XAUUSD Price Projections until 2050
Forecasting the price of gold for 2040–2050 is challenging. Technological progress, geopolitical shifts, demographic changes, and even the emergence of new forms of money (such as the widespread adoption of central bank digital currencies) are all impossible to predict.
However, the inability to predict markets with precision does not diminish the value of expert forecasts. By considering a range of opinions, investors can gain a broader understanding of possible market scenarios, helping them make informed investment decisions and build long-term strategies based on diversification and risk hedging.
Coin Price Forecast estimates that the gold price may reach $11,349.00 by the end of 2033. The bullish rally is expected to continue through 2035–2037, bringing the price to $14,329.00.
Year | Coin Price Forecast, $ |
2031 | 9,090.00 |
2033 | 11,349.00 |
2035 | 12,817.00 |
2037 | 14,329.00 |
XAUUSD (Gold) Market Sentiment on Social Media
Media sentiment is the collective opinion of traders and investors regarding the outlook for XAUUSD, as expressed through posts, comments, and discussions on social media. Positive sentiment signals a price increase, while negative sentiment indicates a decline.
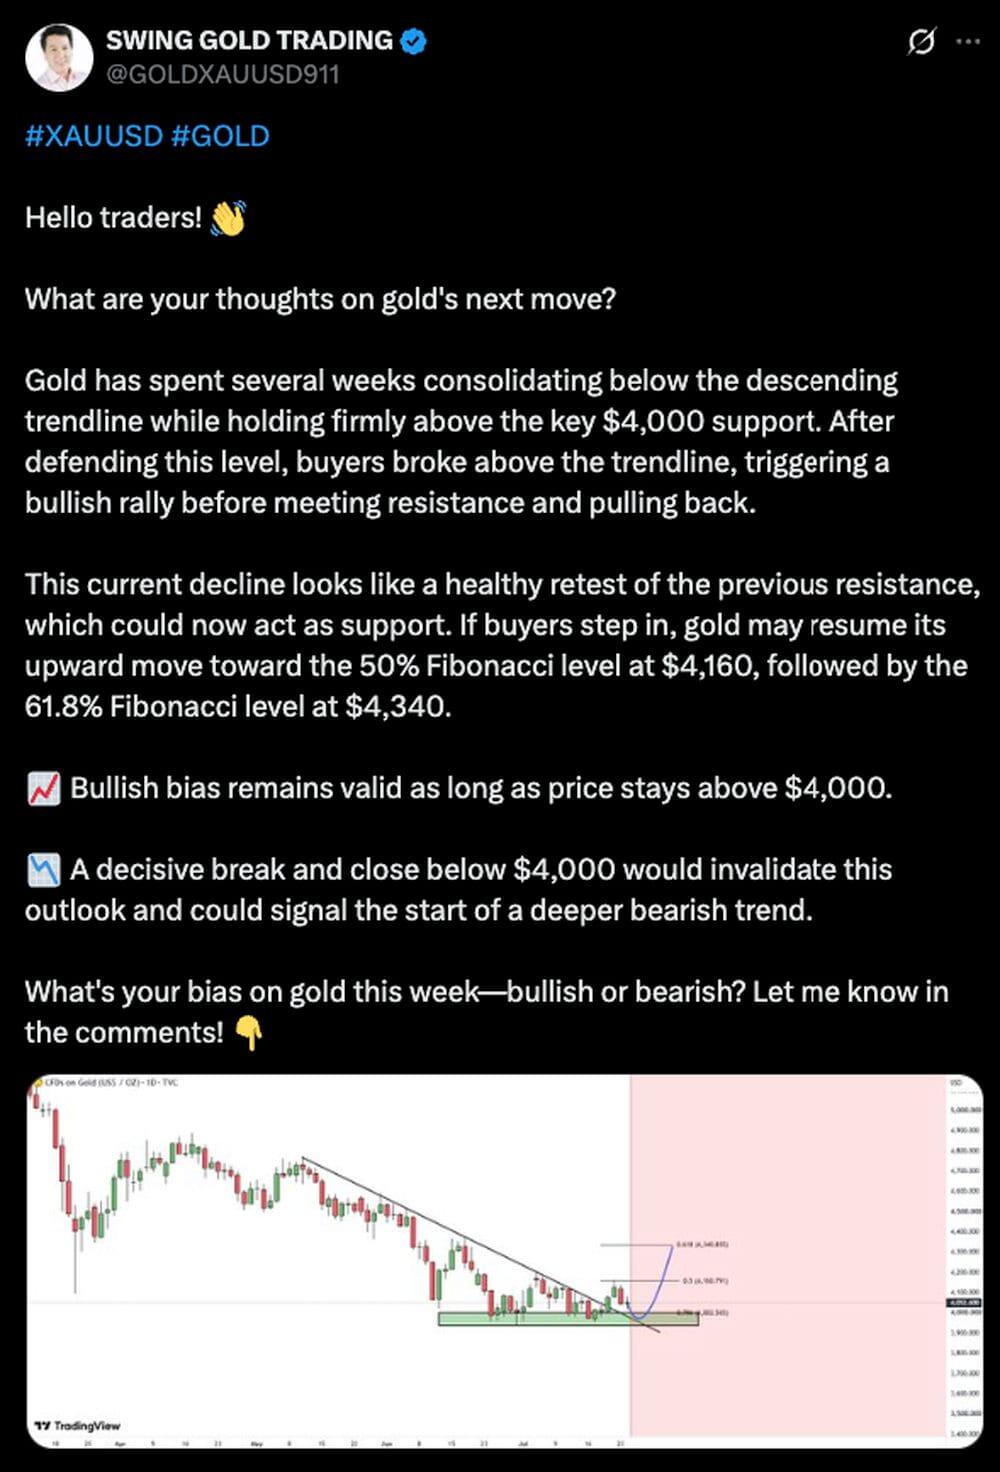
For example, user @GOLDXAUUSD911 predicts on X (formerly Twitter) that the gold price will rise to $4,160.00–$4,340.00 in the near future if it stays above $4,000.00.
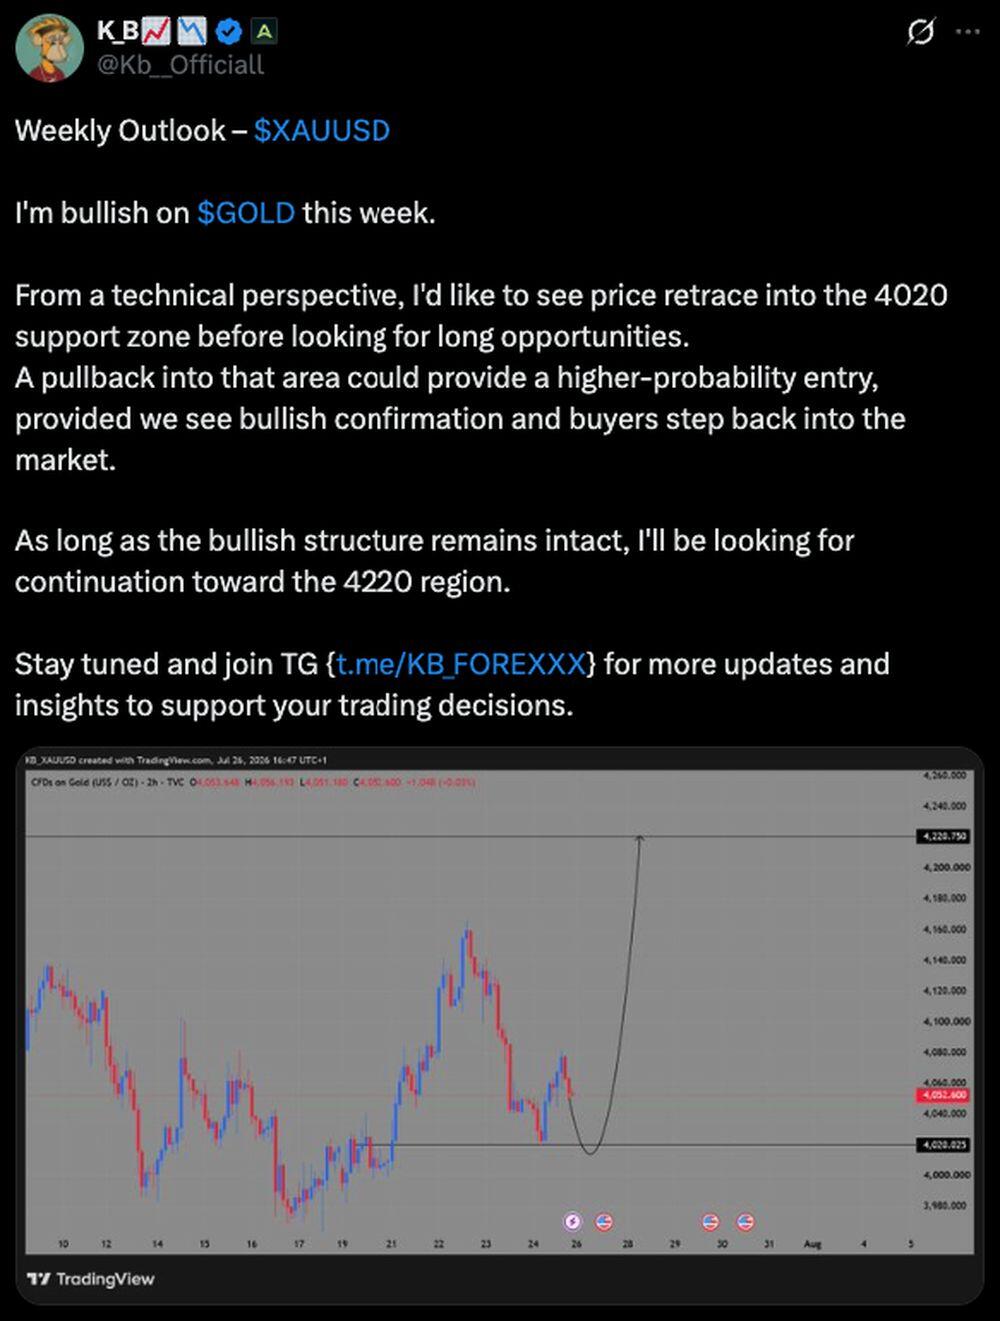
Independent expert @Kb_Officiall is also optimistic about gold's price, forecasting an increase to $4,220.75 in the short term.
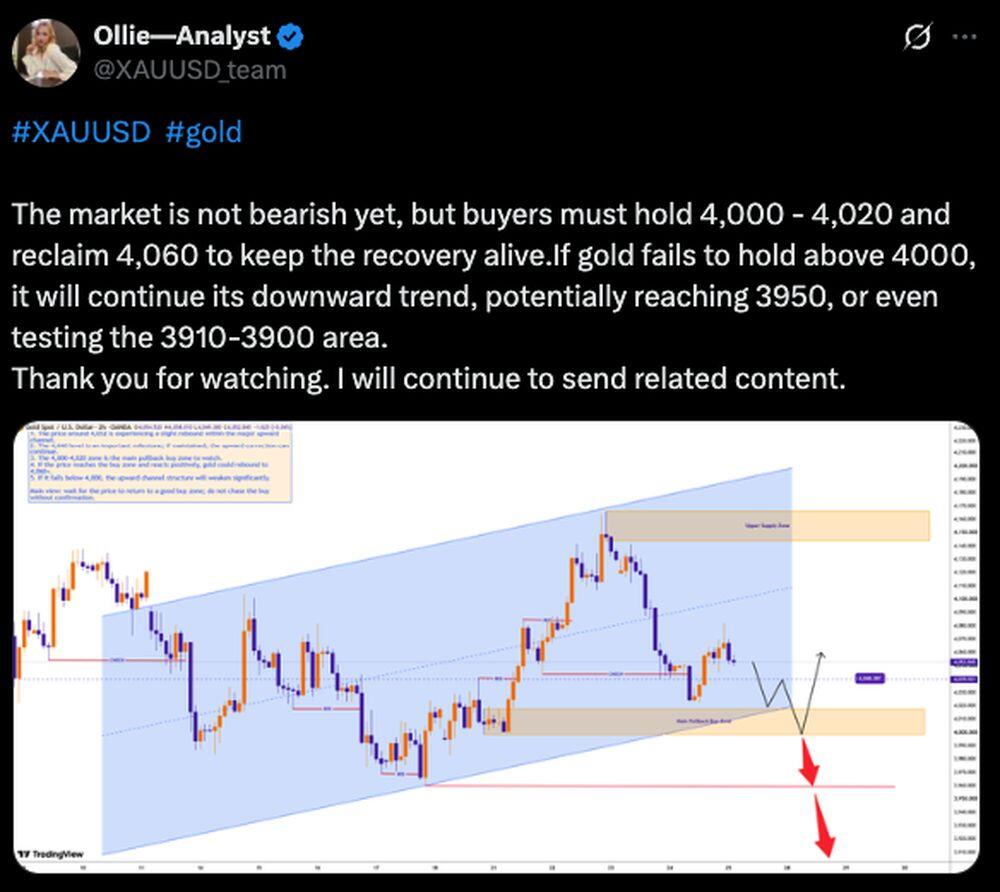
User @XAUUSD_team points to a target of $4,060.00. The trader believes the price could continue to rise if it holds above $4,000.00. Otherwise, there is a risk of a further decline to $3,950.00–$3,900.00.
Based on posts on X, many traders and investors appear to be positive about upcoming fluctuations in the price of gold.
Gold Price History (XAU/USD)
Gold reached its all-time high of $5595.42 on 29.01.2026. The lowest price of gold was recorded on 25.08.1999, when the asset declined to $252.55.
Below is the chart of XAU/USD covering the past 10 years. To make our forecasts as accurate as possible, it's important to estimate historical data.
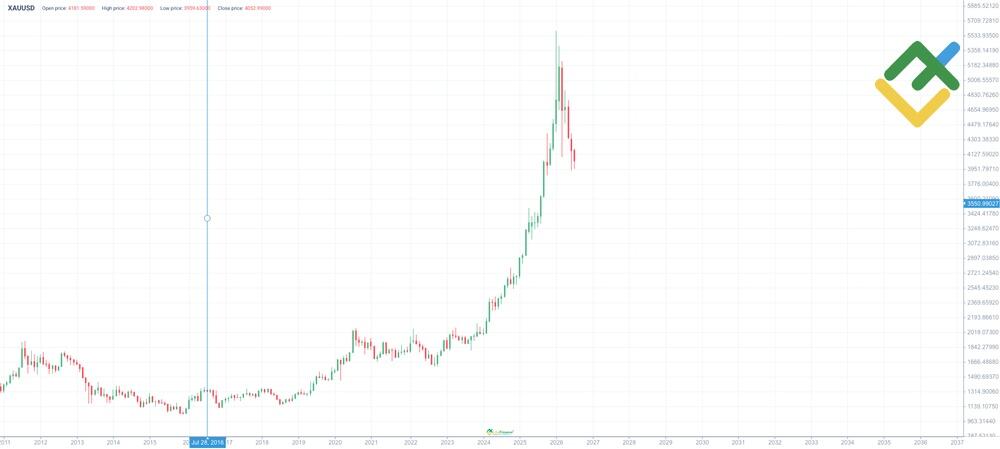
In 2021, as the global economy began to recover and inflation rose, gold prices fluctuated in response to shifts in monetary policies from major central banks. A strengthening US dollar put downward pressure on gold prices.
In 2022, geopolitical tensions, particularly the conflict in Ukraine, drove gold prices upward again. Inflation continued to climb, prompting central banks to tighten monetary policy.
A tug-of-war between inflationary expectations and rising interest rates marked 2023 and 2024. Gold remained sensitive to changes in bond yields and the geopolitical landscape.
From January to April 2025, gold prices rose from $2,624.61 to $3,499.98 amid escalating geopolitical tensions. Between late April and mid-August, the metal traded within a relatively narrow range of $3,120.83–$3,451.11. In late August 2025, the price rose to $4,381.24 before correcting.
At the end of December 2025, gold was trading near $4,550.00 amid strong demand for safe-haven assets. In early January, the asset stood at around $4,331.00. Subsequently, the price began to rise, setting a new all-time high of $5,593.00.
After the asset hit a new all-time high of $5,595.92 in January 2026, it began to decline, reaching $4,053.11 by the end of July. A key factor was the US-Iran conflict in the Middle East, which prompted the US Fed to adopt a more hawkish stance on future monetary policy. Consequently, the interest rate was kept at 3.75% due to high inflation and a strengthening dollar.
Gold Price Fundamental Analysis (XAU/USD)
Fundamental analysis is typically associated with the stock market rather than precious metals. While experts analyze the financial statements of specific companies, XAU/USD analysts monitor macroeconomic factors, global political and economic news, and various forecasts.
What Factors Affect the Gold Rate?
The price of gold is influenced by a variety of economic and geopolitical factors:
- Rising interest rates weigh on the price of gold, as investors switch to higher-yielding assets.
- Gold is often viewed by investors as a hedge against inflation, and rising consumer prices can lead to increased demand for the precious metal.
- During periods of geopolitical unrest, investors seek safe-haven assets such as gold. As a result, the price of the precious metal appreciates.
- Gold is traded in US dollars, so changes in the value of the USD can affect the price of the precious metal.
- The balance between the demand for gold and its supply also plays a crucial role in determining the price of gold.
More Facts About Gold
Gold is one of the longest-standing and most valuable metals, with mining operations dating back over 6,000 years to ancient Egypt. During this period, gold was a symbol of power and wealth. Over time, gold has become a universally accepted means of exchange and an essential component of the global economy. Its scarcity and resilience to external influences drive the continued demand for this precious metal. Gold's limited deposits and mining difficulty make it a valuable asset, particularly during economic uncertainty. In periods of economic turbulence, the demand for gold rises as it offers a reliable hedge against inflation.
Gold is a versatile asset, used not only as an investment tool but also in many industrial applications. In jewelry, it is esteemed for its aesthetic appeal and resilience. In electronics and medicine, gold is employed due to its conductivity and resistance to corrosion. In the space industry, it is used to safeguard equipment from radiation. In addition, gold is a favored asset among traders due to its liquidity. This precious metal is regarded as a symbol of stability and reliability, playing a pivotal role in the global economy.
Advantages and Disadvantages of Investing in Gold
Gold is a popular asset among traders and investors, offering a range of advantages over other asset types.
- Hedge against inflation. Gold has historically been regarded as a means of safeguarding capital against high inflation. In periods of economic turbulence or rising prices for goods and services, the value of gold tends to appreciate, thereby maintaining the purchasing power of investors.
- Portfolio diversification. Investing in gold can help reduce the overall risk of a portfolio. Gold has a low correlation with stocks and bonds, which means its value often moves in the opposite direction of other assets.
- Liquidity. Gold is a highly liquid asset that can be purchased and sold with minimal effort in global markets. This makes it an attractive option for investors who want to quickly convert the asset into cash.
- Reliability during crises. During economic crises and geopolitical tensions, gold is often seen as a safe-haven asset for investors seeking to preserve their capital.
However, there are disadvantages to investing in gold.
- Lack of passive income. Unlike stocks or bonds, gold does not generate passive income such as dividends or interest. Investors only gain profits from the appreciation in the value of gold.
- Volatility. Despite its reputation as a safe-haven asset, gold can show significant volatility in the short term. Sharp price fluctuations can lead to losses for short-term investors.
- Storage and insurance costs. Physical gold incurs storage and insurance costs, especially in large volumes. This can reduce the overall return on investment. Therefore, most investors prefer margin trading in gold CFDs, as it allows them to profit from price fluctuations without actually purchasing gold bullion.
- Dependence on global prices. The value of gold is determined by global factors such as supply and demand, the economic performance of major economies, and the geopolitical environment. This makes it susceptible to external shocks that investors cannot influence.
Gold can be a valuable asset in a diversified portfolio, especially during economic uncertainty. However, it is essential to adopt a cautious approach and to carefully assess the potential risks involved before making investment decisions.
How We Make Forecasts
We employ a comprehensive approach to forecasting gold prices.
- Short-term forecasts rely on technical analysis that factors in indicators, trading volumes, and market sentiment.
- Medium-term forecasts incorporate fundamental factors, such as central bank policy and current geopolitical events.
- Long-term forecasts consider global macroeconomic trends, shifts in world trade and gold demand, as well as projections from leading forecasting agencies.
Conclusion: Is Gold a Good Investment?
Gold appears to be a reliable way to preserve money during times of crisis and rising prices, when other assets fall in value. Strong demand for gold worldwide makes the XAUUSD pair an attractive long-term investment.
However, gold does not generate interest income, and its price can fluctuate significantly because of market speculation. In addition, holding physical gold entails extra expenses related to storage and insurance.
Although gold is not a one-size-fits-all solution, it can be a valuable asset for portfolio diversification. The XAUUSD pair can help reduce risk and provide protection against inflation. Nevertheless, it is essential to perform fundamental and technical analysis and study expert assessments before making any trading or investment decisions.
Gold Price Prediction FAQ
The current gold price as of 30.07.2026 is $4 077.14.
Predicting the price of gold is challenging, as its value is influenced by a variety of factors, including geopolitical tensions, inflation, interest rates, and supply and demand trends. Short-term fluctuations can be unpredictable, but in the long term, gold is often seen as a safe haven during periods of uncertainty.
Gold prices will depend on geopolitical developments, inflation, and demand for safe-haven assets. If current trends persist, the metal may rise moderately, trading between $7,166.41 and $9,406.67 by 2030. A more pessimistic forecast sees gold remaining around $2,814.92.
In the long term, the gold price will be influenced by technological demand, production, and global reserves. If the trend toward asset diversification continues, the price may hit up to $13,247.00. However, it is impossible to predict exact figures.
Gold is considered a safe-haven asset, especially during periods of economic instability. However, buying gold also involves risks. It is important to carefully analyze the market and consider the opinions of financial experts before making a decision.
The future of the XAUUSD pair, which reflects the price of gold against the US dollar, is closely tied to the dollar's strength and global demand for gold. US economic data, the Fed's decisions, and geopolitical events will continue to influence the pair.
Whether to invest in gold now depends on your financial goals and risk tolerance. Gold can serve as a hedge against inflation and economic uncertainty. Still, it's not advisable to put all your savings into gold. It's better to view it as a tool for portfolio diversification.
It is challenging to predict with certainty when the price of gold will surge. Growth can be driven by various factors, such as inflation, geopolitical crises, or interest rate cuts. Investors are advised to closely monitor market developments and conduct thorough analyses.
Gold is considered a safe-haven asset with a steadily increasing value. As such, XAU/USD is unlikely to depreciate significantly and will remain in demand as a hedge against risks tied to escalating economic and geopolitical tensions.
Most analysts do not expect a significant decline in the price of gold. Despite possible corrections, the price is expected to maintain stable growth. After all, gold is an asset that can retain its value during market fluctuations and increased economic uncertainty.
Gold is often considered a refuge during periods of economic uncertainty. Inflation, a weakening dollar, and geopolitical risks are prompting investors to flock to gold, which is driving up the price of the precious metal. Central banks can also influence the XAUUSD exchange rate with their large purchases.
Price chart of XAUUSD in real time mode

The content of this article reflects the author’s opinion and does not necessarily reflect the official position of LiteFinance broker. The material published on this page is provided for informational purposes only and should not be considered as the provision of investment advice for the purposes of Directive 2014/65/EU.
According to copyright law, this article is considered intellectual property, which includes a prohibition on copying and distributing it without consent.